
")
")
")
")
")


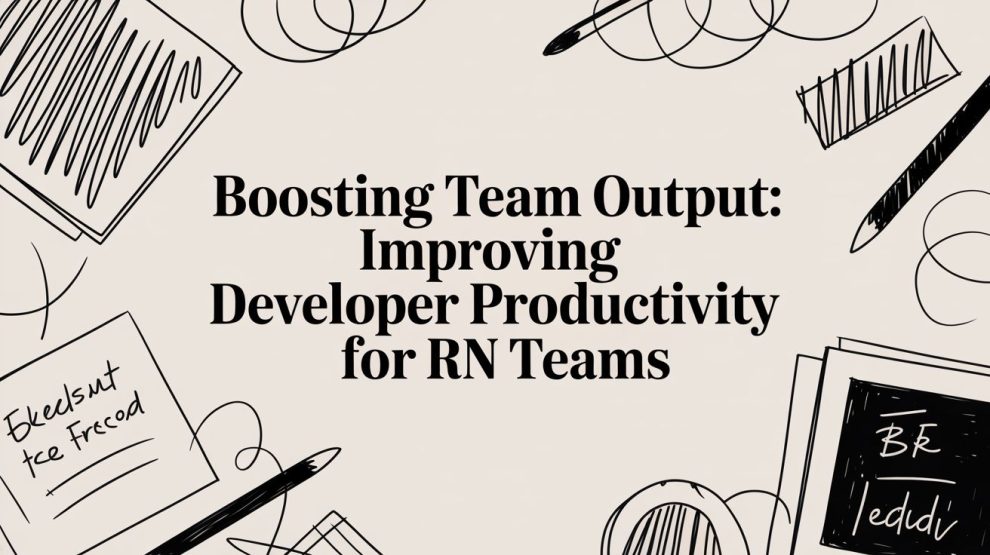
Improving developer productivity for a React Native team isn't about counting lines of code or hammering out more commits. It's about finding and eliminating the friction that slows engineers down. The real goal is to build an environment where developers can get into a flow state, see the results of their work instantly, and aren't constantly juggling a dozen complex mental models just to get something done. When you do that, productivity isn't a metric you chase; it’s the natural result of a great developer experience.
Rethinking Developer Productivity in React Native
For years, many of us in leadership roles have been guilty of trying to measure productivity with flimsy metrics like pull request volume or story points. These numbers rarely tell the whole story. Is an engineer's PR count low because they're stuck, or because they're knee-deep in architecting a critical new feature or mentoring two junior developers? Those are wildly different scenarios, but the metrics look the same.
A much better way to think about this is to focus on three core pillars:
- Flow State: This is that magic zone of deep, focused concentration where developers are at their most creative and effective. Slow builds, flaky tools, and constant interruptions shatter that state.
- Feedback Loops: How fast can a developer see the impact of a code change? In the world of React Native, we're talking about near-instant updates on a device when you hit save—not staring at a spinner for minutes while a native build churns away.
- Cognitive Load: This is simply the amount of brainpower it takes to do a task. A convoluted Git branching strategy, out-of-date documentation, or inconsistent tooling all pile on the mental effort, leading to mistakes and burnout.
Treat your team's developer experience (DevEx) like you treat your flagship product. If your internal tools and workflows are fast, intuitive, and reliable, high productivity and happy engineers will follow.
Diagnosing Your Team's Productivity Health
Before you can start fixing things, you need an honest look at where the pain points are. Most teams aren't crippled by one single, massive problem. Instead, they’re slowly being bled by a thousand tiny paper cuts—those small, daily annoyances that add up to a huge amount of wasted time and frustration. A local build that takes an extra 20 seconds might not seem like a big deal, but when it happens hundreds of times a day across the whole team, you're losing hours of focused work.
A quick health check is the best way to get a baseline. This isn't about pointing fingers; it's about putting the system itself under a microscope.
I've put together this quick-scan table to help engineering leads and managers audit their own team's development lifecycle. Use it to spot the high-friction areas that are likely costing you the most.
Developer Productivity Health Checklist
| Productivity Area | Healthy Sign (Low Friction) | Warning Sign (High Friction) |
|---|---|---|
| Local Development | Code changes show up in the app in <2 seconds. Hot reloading keeps the app state. | Full app recompiles take over 30 seconds. Developers constantly have to restart the app. |
| CI/CD Pipeline | Most PR builds finish in under 10 minutes. Flaky tests are a rare occurrence. | CI pipelines take 20+ minutes, blocking merges. Tests fail unpredictably. |
| Code Review | Pull requests are small, focused, and usually merged within a day. | PRs are massive, sit for days, and ignite long, unfocused debates. |
| Onboarding | A new hire can get the project running and ship a tiny change on their first day. | Setup takes multiple days and requires help from several senior engineers. |
| Documentation | Key architectural decisions and setup guides are documented and easy to find. | Critical info is "tribal knowledge" that only lives in a few people's heads. |
Going through this checklist should give you a gut check on where your team stands. If you find yourself nodding along with the "Warning Sign" column more often than not, don't worry—it just means you've found the perfect place to start making improvements.
Auditing Your Current Workflow: Where's the Friction?
Before you can speed up your team, you have to know what’s slowing them down. It's tempting to jump to conclusions—blaming a slow CI pipeline or a complex codebase—but without real data, you're just guessing. The first step is to trade those gut feelings and anecdotal complaints for a clear, data-backed picture of the friction in your React Native development process.
This isn’t about micromanaging people or tracking lines of code. It's about diagnosing the health of your system. Think of it like being a detective: you're looking for clues that reveal the hidden bottlenecks and time sinks that are costing your team focus and momentum.
The goal is to protect a developer's flow state by tightening feedback loops and reducing their cognitive load. When any of these areas are compromised, productivity takes a hit.

As you can see, disruptions in one area tend to cascade, pulling developers out of deep work and dragging down the entire delivery cycle. The only way to know where these disruptions are happening is to start gathering both hard numbers and real-world feedback from the team.
Starting with Quantitative Metrics
Numbers give you an objective baseline. The good news is you don't need a fancy, expensive platform to get started; you can get surprisingly far with simple scripts and the logs you already have in your CI system.
Focus on a few high-impact metrics that tell a story about where time is really going.
- Local Build and Reload Times: How many seconds pass between a developer saving a file and seeing the change on their screen? This is the most frequent feedback loop, and even small delays add up massively over a week. Time both a "cold" start (the very first
npm start) and a "hot" reload. - CI Pipeline Duration: Measure the clock time from when a pull request is opened to when all the checks turn green. A long or flaky CI process is a notorious source of context switching and frustration.
- Pull Request Lead Time: How long does a PR sit open, from creation to merge? This number is a powerful indicator of bottlenecks in your code review and approval process. A long lead time often points to PRs being too large or reviewers being unavailable.
By focusing on system-level metrics like pipeline duration and PR lead time, you shift the conversation from individual performance to process improvement. It becomes about making the system faster for everyone, not about pressuring individuals to code faster.
Gathering Qualitative Feedback
Metrics tell you what is happening, but they don't always explain why. That 20-minute CI run might be slow because of inefficient tests, or it could be running on underpowered build agents. The only way to find out for sure is to talk to your team.
This qualitative data uncovers the human side of the equation—the daily frustrations and paper cuts that numbers alone can't capture. Are they fighting with flaky tests? Is the local setup a nightmare? This is where you'll find the real story.
Creating a Simple Productivity Dashboard
Once you have this initial data, pull it all together into a simple, shared dashboard. This doesn't need to be some complex, real-time analytics tool. A basic wiki page or a shared spreadsheet is more than enough to get started. The goal is to make the problems visible and establish a baseline so you can track your progress.
For instance, your first-pass dashboard might look something like this:
| Metric | Current Baseline | Goal |
|---|---|---|
| Local Reload Time | 8 seconds (avg) | < 2 seconds |
| CI Build Time (PR) | 22 minutes (avg) | < 12 minutes |
| PR Lead Time | 48 hours (avg) | < 24 hours |
| Developer Frustration | CI Flakiness (High) | CI Flakiness (Low) |
This simple table immediately gives you a powerful starting point. It clearly identifies your biggest bottlenecks—in this case, a sluggish CI pipeline and a slow code review cycle—and sets tangible goals. With this data in hand, you're finally ready to make targeted, impactful changes instead of just shooting in the dark.
Optimizing Your Local Development Environment
Once you've pinpointed the friction in your workflow, your local development environment is the best place to start making changes. This is where your developers live and breathe every day. Every single second shaved off that "code, save, see" loop gets multiplied across every engineer on your team, every single day.
A slow, clunky local setup is more than just an annoyance; it's a constant source of frustration that shatters focus and kills momentum. It directly cripples your team's ability to get into—and stay in—a state of flow.
The difference between a sluggish environment and a well-oiled one is night and day. Imagine a developer tweaks a UI component and hits save. In a frustrating setup, they might be staring at the screen for 30 seconds or more waiting for a full app recompile. In a streamlined world, they see that change in under 2 seconds. That seemingly small 28-second gap, repeated hundreds of times a week, adds up to hours of reclaimed productivity and keeps your engineers engaged and creative.

Activating Hermes for a Performance Boost
One of the quickest wins you can score is enabling the Hermes JavaScript engine. Meta built Hermes specifically for React Native, optimizing it to slash startup times, cut down on memory usage, and shrink the final app size.
For your developers, this means a snappier, more responsive app right there on their simulator. Turning it on is usually a simple, one-line change in your android/app/build.gradle and ios/Podfile. Making this switch is a fantastic first step toward tightening that feedback loop.
Mastering Fast Refresh and the Metro Bundler
The heart of a fast React Native workflow is its hot reloading capability. Fast Refresh is an absolute game-changer. It lets you see component changes almost instantly without blowing away your app's current state. This is a massive leap forward from the old days of native development.
But as projects get bigger, the default configuration of the Metro bundler can start to feel sluggish. The time it takes Metro to resolve all your dependencies and bundle the code can slowly creep up, adding precious seconds to your wait time.
The goal is to make the feedback loop so tight that it feels like you're directly manipulating the UI. When a developer saves a file and the change appears instantly, they can experiment freely and solve problems faster without the mental context switch of waiting for a build.
To fight back against this slowdown, you can dive into advanced Metro configurations. Here are a few strategies that have worked wonders for our teams:
- Use a Custom
metro.config.js: Create this file in your project's root to override the defaults. You can implement custom resolvers or transformers to seriously speed things up. - Lean on the Cache: Metro has a built-in cache that's incredibly powerful when it works right. While occasionally clearing it (
--reset-cache) can fix weird bugs, a warm cache is your best friend for day-to-day speed. - Optimize Asset Handling: You can configure Metro to handle assets like images and fonts more efficiently. Sometimes this means excluding huge assets from the development bundling process altogether.
Specific Optimizations for Expo Users
If your team is on Expo, you’ve got some powerful tools at your disposal that can be fine-tuned for a much better local experience. A key area to focus on is the expo prebuild command, which generates the native ios and android directories.
While essential, running prebuild can be a real time-sink. The trick is to run it only when you absolutely have to—like after adding a new native library that needs custom wiring. For any pure JavaScript changes, you can stay within the Expo Go environment for the fastest possible iteration speed.
You should also seriously consider using development builds with expo-dev-client. This approach gives you the best of both worlds: the rapid workflow of Expo with the flexibility to drop in custom native code. It allows you to create your own version of the Expo Go app that already includes your project's native dependencies, which dramatically cuts down on startup times compared to running prebuild over and over.
For teams working on Macs, a solid foundation is non-negotiable. If you're starting out, check out our guide on how to install and setup React Native on Mac to ensure a smooth start.
Building a Faster CI/CD Pipeline
A sluggish Continuous Integration/Continuous Deployment (CI/CD) pipeline is a silent killer of developer productivity. It's the digital equivalent of a long, frustrating traffic jam that forces developers to switch context, lose momentum, and wait. Transforming this bottleneck into a fast, reliable automation workflow gives your team the quick feedback they need to stay focused and ship code confidently.
The goal is to deliver meaningful validation in minutes, not hours. When a developer pushes a change, they shouldn't have to wait 30 minutes just to find out a simple linting rule failed. A snappy pipeline reinforces good habits, encourages smaller, more frequent commits, and ultimately shortens the entire cycle from idea to production.

Right-Sizing Your Testing Strategy
One of the most common mistakes I see teams make is running an entire, exhaustive test suite on every single commit. This "all or nothing" approach feels safe, but it's incredibly slow. A much more effective strategy is to "right-size" your tests based on the context of the change.
Think of it as a tiered approach to validation:
- On Every Commit: This is for the lightning-fast checks. Run your static analysis (linting, type checking) and your core unit tests. These are isolated, quick, and provide an immediate sanity check, ideally in under five minutes.
- On Pull Request Creation: When a PR is opened, it's time to expand the scope. This is a great place for integration tests that verify how different parts of your application interact with each other.
- On Merge or Nightly Builds: Save your most comprehensive and time-consuming tests for less frequent runs. Full end-to-end (E2E) tests that simulate real user journeys are vital, but they don't need to block every single commit. Running them nightly provides a strong safety net without becoming a constant bottleneck.
This method ensures developers get fast feedback for most of their work while maintaining high confidence in the app's overall stability.
A pipeline that runs in 8 minutes and catches 95% of common errors is far more valuable to developer productivity than a 45-minute pipeline that catches 99%. Always optimize for the fastest possible feedback loop that still provides a high degree of confidence.
Leveraging Caching and Parallelization
Beyond just restructuring your tests, you can find massive speed gains by optimizing how your pipeline actually runs its jobs. Caching and parallelization are your two best friends here.
Caching Dependencies: Your CI pipeline shouldn't have to download all your node_modules from scratch every single time. It’s a huge waste of time and network resources. Configure your CI provider to cache these dependencies. After the first run, subsequent jobs can restore the cache in seconds instead of re-downloading everything, often shaving several minutes off your build time right there.
Parallelizing Test Suites: If your entire test suite takes 20 minutes, don't just accept it. Split it up! Most modern CI platforms let you parallelize jobs, running different parts of your test suite simultaneously across multiple virtual machines. By splitting a 20-minute suite across four parallel jobs, you can bring that step down to a much more manageable five minutes.
Optimizing Your React Native Build Tools
For React Native teams, tools like Expo Application Services (EAS) Build and Fastlane are central to the CI/CD process. Fine-tuning their configurations is key.
With EAS Build, you should be taking full advantage of its built-in caching. EAS automatically caches dependencies like npm packages and CocoaPods between builds. You can optimize this even further by structuring your eas.json profiles to reuse caches effectively, especially for builds with minimal changes to native code. Our guide on how to publish a React Native application to Expo covers key deployment concepts that tie into this.
If your team is using Fastlane, focus on breaking your Fastfile into smaller, modular lanes. Instead of one giant lane that does everything, create separate lanes for testing, building, and deploying. This modularity makes it easier to run specific parts of your process and improves the reusability of your automation scripts. It also makes it much simpler to pinpoint and fix any bottlenecks in your workflow.
Individual developer speed is just one piece of the puzzle. A single engineer churning out code at lightspeed doesn't mean much if their work gets bottlenecked in a week-long code review or triggers a multi-day merge conflict nightmare. When we talk about boosting developer productivity, we're really talking about a team sport. It's about creating a flywheel effect where seamless collaboration and high code quality let everyone ship better software, faster.
This means shifting your focus from individual output to the overall health of your team's workflows. Are your code reviews quick and constructive? Do your branching strategies prevent headaches instead of causing them? Getting these team processes right is the foundation for any high-velocity development.

Streamlining Code Reviews and Pull Requests
The pull request (PR) process is often where productivity goes to die. We've all seen it: massive, sprawling PRs that sit stale for days, forcing massive context-switching costs on both the author and the reviewers. The secret is to keep PRs small, focused, and easy to digest.
A pull request should really only do one thing. Sticking to this discipline pays off in several ways:
- Faster Reviews: It's way easier for a reviewer to grasp the context of a 50-line change, give meaningful feedback, and hit approve. A 1,000-line behemoth is just an exercise in frustration for everyone involved.
- Easier Debugging: If a small PR introduces a bug, you can isolate and revert that specific change in minutes.
- Fewer Merge Conflicts: Small, frequent merges dramatically reduce the odds of running into those soul-crushing merge conflicts with a colleague's work.
An easy win here is to implement PR templates. A solid template should prompt the author for crucial context—like a quick summary, a link to the Jira ticket, and maybe a screenshot or video of UI changes. This simple step stops reviewers from having to play detective and gets everyone on the same page instantly.
Adopting Lightweight Branching Strategies
Your branching strategy should work for you, not the other way around. Overly complex models like GitFlow, with all its different long-running branches, can be serious overkill for most fast-moving product teams. They often create more process overhead and merge hell than they're worth.
For most React Native teams, a simpler trunk-based development approach is far more practical. Developers create short-lived feature branches directly from the main branch and merge them back as soon as they're done—ideally within a day or two. This fits perfectly with the goal of small, frequent PRs and keeps your main branch stable and ready to ship at all times.
The core principle is simple: the longer a branch lives on its own, the more it drifts from the main codebase. That drift is what leads to painful, complex merges. Keep your branches short-lived to keep integration headaches to a minimum.
Augmenting Workflows with AI Tooling
Modern AI tools have moved beyond novelty and are becoming powerful collaborators for development teams. Instead of replacing engineers, they act as incredibly smart assistants, automating the grunt work so developers can focus on tough architectural problems and creative solutions.
This is especially true in the React Native world. The latest research points to AI integration promising 30-50% leaps in prototyping and bug fixing, which directly speeds up mobile development. We're seeing teams achieve 50% faster prototyping with AI-generated components and catch 25% more bugs with automated code analysis. These are real, tangible gains.
Here’s how AI is changing the game for teams:
- Automated Bug Detection: AI-powered linters and analyzers can scan your code as you write it, flagging subtle bugs, potential race conditions, and performance issues long before a human reviewer even lays eyes on it.
- Intelligent Refactoring: Some tools can analyze a component, spot areas for improvement, and suggest refactors to make it more readable, performant, or reusable.
- Boilerplate Generation: Need a new Redux slice or a basic set of Jest tests for a simple component? AI can spit out that repetitive boilerplate in seconds, letting your team get straight to the interesting logic. A strong testing foundation is crucial, and you can learn more by checking out our guide on unit and E2E testing in React Native.
By bringing these tools into your workflow, you’re not just making individuals faster. You’re building a smarter, more resilient development process that catches mistakes early, encourages better code, and frees up your team to focus on what they do best: building an amazing app.
Adopting the New Architecture for a Productivity Leap
When you hear about React Native's New Architecture, most of the talk is about performance. But make no mistake, this is a massive investment in developer productivity, too. The real win here is the death of the old, asynchronous bridge—a notorious source of sneaky bugs and performance nightmares.
This isn't just a minor tweak; it fundamentally changes how your engineers interact with the native side. By introducing a more direct and synchronous communication layer, it rips out a huge bottleneck that teams used to spend countless hours working around.
What does that mean for your team? Less time wrestling with bizarre timing issues or trying to eke out a bit more performance from a scrolling list. Engineers can finally stop fighting the framework and start building complex, high-performance features with more confidence and less friction.
The real game-changer with the New Architecture is that developers can finally stop thinking about "the bridge" as a potential culprit. This reduction in cognitive load is a huge productivity win, freeing up mental space to solve actual business problems.
How This Impacts Your Day-to-Day Workflow
You'll see the difference almost immediately in your development cycle.
Components built with Fabric, the new rendering system, feel snappier and act more like true native components. This means your developers can craft fluid animations and sophisticated UIs without having to jump through hoops or rely on clever workarounds.
Then there's TurboModules. They offer direct, synchronous access to native modules, which is a blessing for any feature that needs tight integration with the device's platform APIs. No more callback hell or unpredictable delays.
The performance uplift isn't trivial, either. We're talking about a significant leap forward. Recent cross-platform development findings show that apps on the New Architecture can achieve cold start times within 15-20% of their fully native counterparts. That's a dramatic improvement that gives you a much better user experience right out of the gate.
At the end of the day, adopting the New Architecture means your team spends far less time stuck in optimization cycles and more time actually shipping features. It raises the performance baseline so high that developers can focus on innovation, knowing the foundation they're building on is both solid and incredibly fast.
Frequently Asked Questions
Even with a solid plan, you're bound to run into questions when you start overhauling your team's workflow. Let's tackle some of the most common ones we hear from engineering managers and developers trying to boost their React Native productivity.
What's the Single Biggest Win for a React Native Team?
While every team's context is a bit different, the one change that delivers the most bang for your buck is almost always shortening the local development feedback loop. Think about it—it’s the one action your developers repeat hundreds of times a day.
When you nail this, you shrink the time between a code change and seeing it on screen from minutes down to just a couple of seconds. This is where tools like Fast Refresh, a well-configured Metro bundler, and the Hermes engine really shine. Getting this right allows developers to stay in a flow state, experiment quickly, and squash UI bugs almost instantly. The cumulative time savings are enormous, and the morale boost is just as significant.
Optimizing the local dev loop offers the highest return on investment. A two-second feedback cycle is a force multiplier for the entire team, making every other task feel faster and more fluid.
How Do We Actually Measure Productivity Without Micromanaging?
This is a great question, and the key is to shift your focus from individual output to system-level metrics. Tracking things like lines of code or commit frequency is a classic mistake. It often creates the wrong incentives and tells you very little about the actual health of your team.
Instead, start measuring the efficiency of your development process itself. Look at metrics like:
- Cycle Time: How long does it take from the first commit on a feature branch to that code being live in production?
- Pull Request Lead Time: How much time passes from the moment a PR is opened until it's merged?
- CI/CD Pipeline Duration: What’s the total time your automated checks and builds take to complete?
These numbers give you a clear, objective look at the health of your entire system. When you pair this quantitative data with qualitative feedback from your regular developer retrospectives, you start to understand the "why" behind any bottlenecks.
Is Moving to the New Architecture Really Worth the Effort?
For most teams, especially those building apps with complex UIs or deep native integrations, the answer is a firm "yes." It's an investment, for sure, but the migration pays for itself by eliminating an entire class of performance issues tied to the old asynchronous bridge.
What does that mean in practice? It means your developers spend far less time bogged down in tricky performance optimizations and can focus on building more sophisticated features with confidence.
At React Native Coders, we share the latest tutorials, news, and strategic insights to help your team build, test, and ship faster. Dive into our guides to stay ahead in the ever-evolving React Native ecosystem. Learn more at reactnativecoders.com.


")
")
")
")
")
Add Comment